- Analyses
- Analyse technique
Petrole Analyse technique - Petrole Trading: 2016-05-26
Psychological level of $50 per barrel
Brent oil barely reacts on positive data. They failed to hit a fresh high on Wednesday despite the substantial fall in US oil stockpiles and strike on French oil refineries. May oil correct down?
US crude oil stockpiles fell 4.2mln barrels last week instead of the expected fall by -2.5mln barrels, according to U.S. Energy Information Administration This was their record decline 7 weeks, mainly triggered by lower purchases of oil in Canada due to wildfires. The independent American Petroleum Institute was even more pessimistic and predicted the US oil stockpiles to slump by 5.1mln barrels. France used its strategic oil supplies for the first time since 2010 to neutralize the strike of workers in oil refineries who protest against cuts in social benefits. In general, fundamental factors do not yet point at sharp fall in oil prices. Nevertheless, the level of $50 a barrel is a serious psychological level. Let’s consider the downward price correction by means of technical analysis.
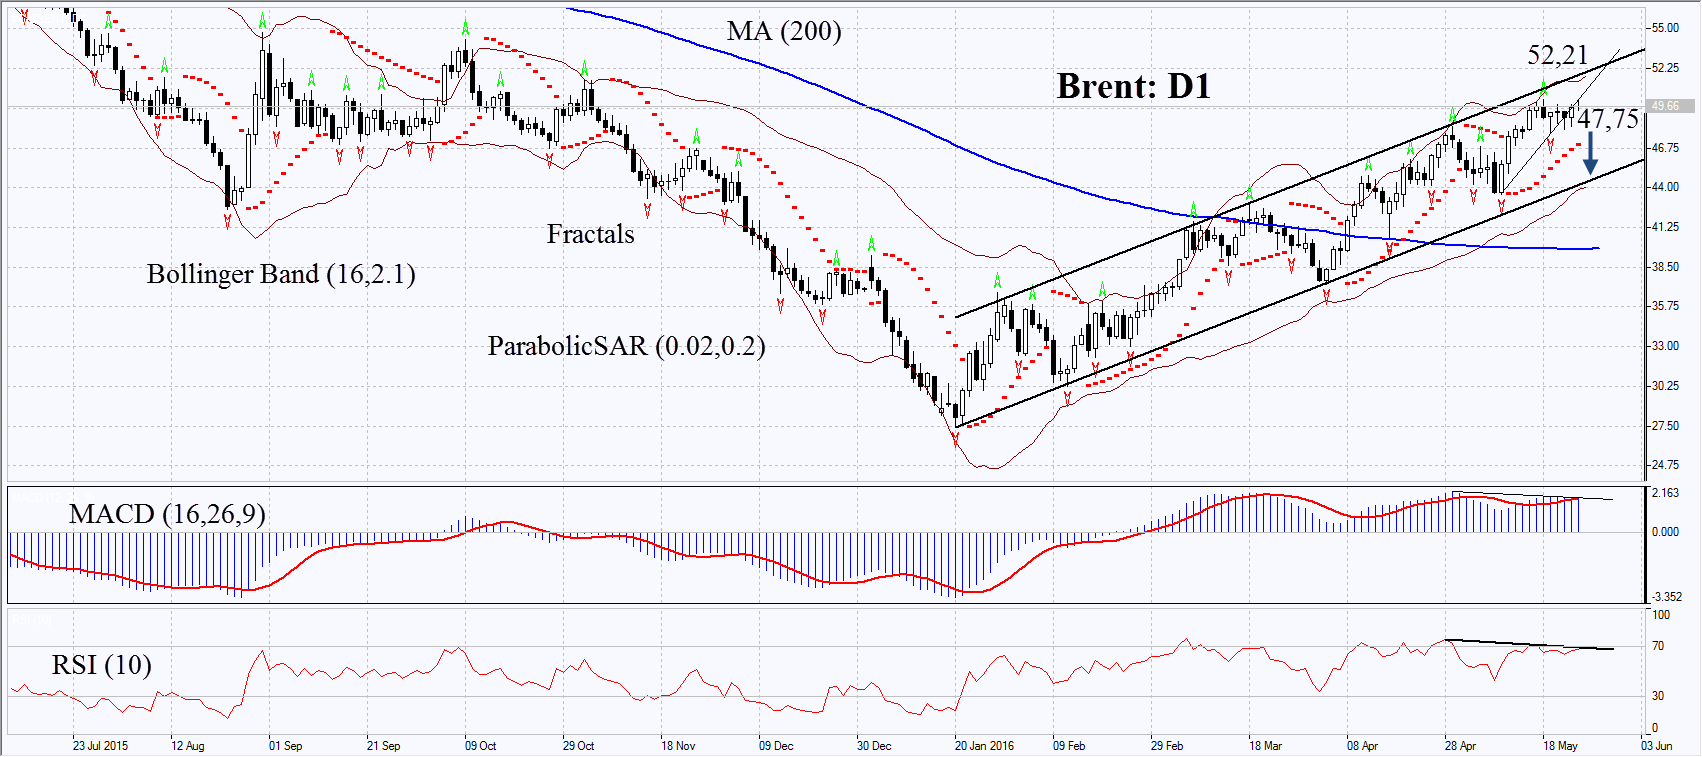
On the daily chart Brent: D1 is in rising trend near its upper boundary. The MACD gives signal to sell. The Parabolic has not reversed down and its signal may serve the additional level of support. The RSI has formed negative divergence and is on the verge of overbought zone. The Bollinger bands have contracted which means lower volatility. The bearish momentum may develop in case the oil prices dip below last fractal low at 47.75. This level may serve the point of entry. The initial stop-loss may be placed above the last fractal high and upper line of the rising channel at 52.21. Having opened the pending order we shall move the stop to the next fractal high following the Parabolic and Bollinger signals. Thus, we are changing the probable profit/loss ratio to the breakeven point. The most risk-averse traders may switch to the 4-hour chart after the trade and place there a stop-loss moving it in the direction of the trade. If the price meets the stop-loss level at 47.75 without reaching the order at 52.21, we recommend cancelling the position: the market sustains internal changes which were not taken into account.
| Position | Sell |
| Sell stop | below 47.75 |
| Stop loss | above 52.21 |
- Obtenir un certificat

NB:
Cet aperçu a un caractère instructif et didactique, publié gratuitement. Toutes les données, comprises dans l'aperçu, sont reçues de sources publiques, reconnues comme plus ou moins fiables. En outre, rien ne garantit que les informations indiquées sont complètes et précises. Les aperçus ne sont pas mis à jour. L'ensemble de l'information contenue dans chaque aperçu, y compris l'opinion, les indicateurs, les graphiques et tout le reste, est fourni uniquement à des fins de familiarisation et n'est pas un conseil financier ou une recommandation. Tout le texte entier et sa partie, ainsi que les graphiques ne peuvent pas être considérés comme une offre de faire une transaction sur chaque actif. IFC Markets et ses employés, dans n'importe quelle circonstance, ne sont pas responsables de toute action prise par quelqu'un d'autre pendant ou après la lecture de l’aperçu.
