- Analyses
- Analyse technique
GB 100 Analyse technique - GB 100 Trading: 2019-02-04
UK companies publish good quarterly earnings reports
The UK’s withdrawal from the European Union without signing a mutual agreement may support an increase in stocks of British companies. Will the GB100 rise?
The weakening of the pound increases the competitiveness of UK companies in foreign markets. The FTSE 100 stock index rose on Friday for the 4th consecutive day. Its growth during a week has been the highest since December 2016. Last week, the British pound showed the maximum decline in the last 7 weeks in anticipation of the next vote in the British Parliament regarding Brexit. It should take place on February 13. The UK’s exit from the EU is scheduled on March 29, 2019. Market participants believe that the Bank of England will support national companies and maintain its super-loose monetary policy at the next meeting on February 7. Additional positive factors for the British stock index were good earnings reports for the 4th quarter of such large companies as Royal Dutch Shell and Diageo. Let us note that the FTSE 100 is now trading with a relatively low P/E ratio of 11.2.
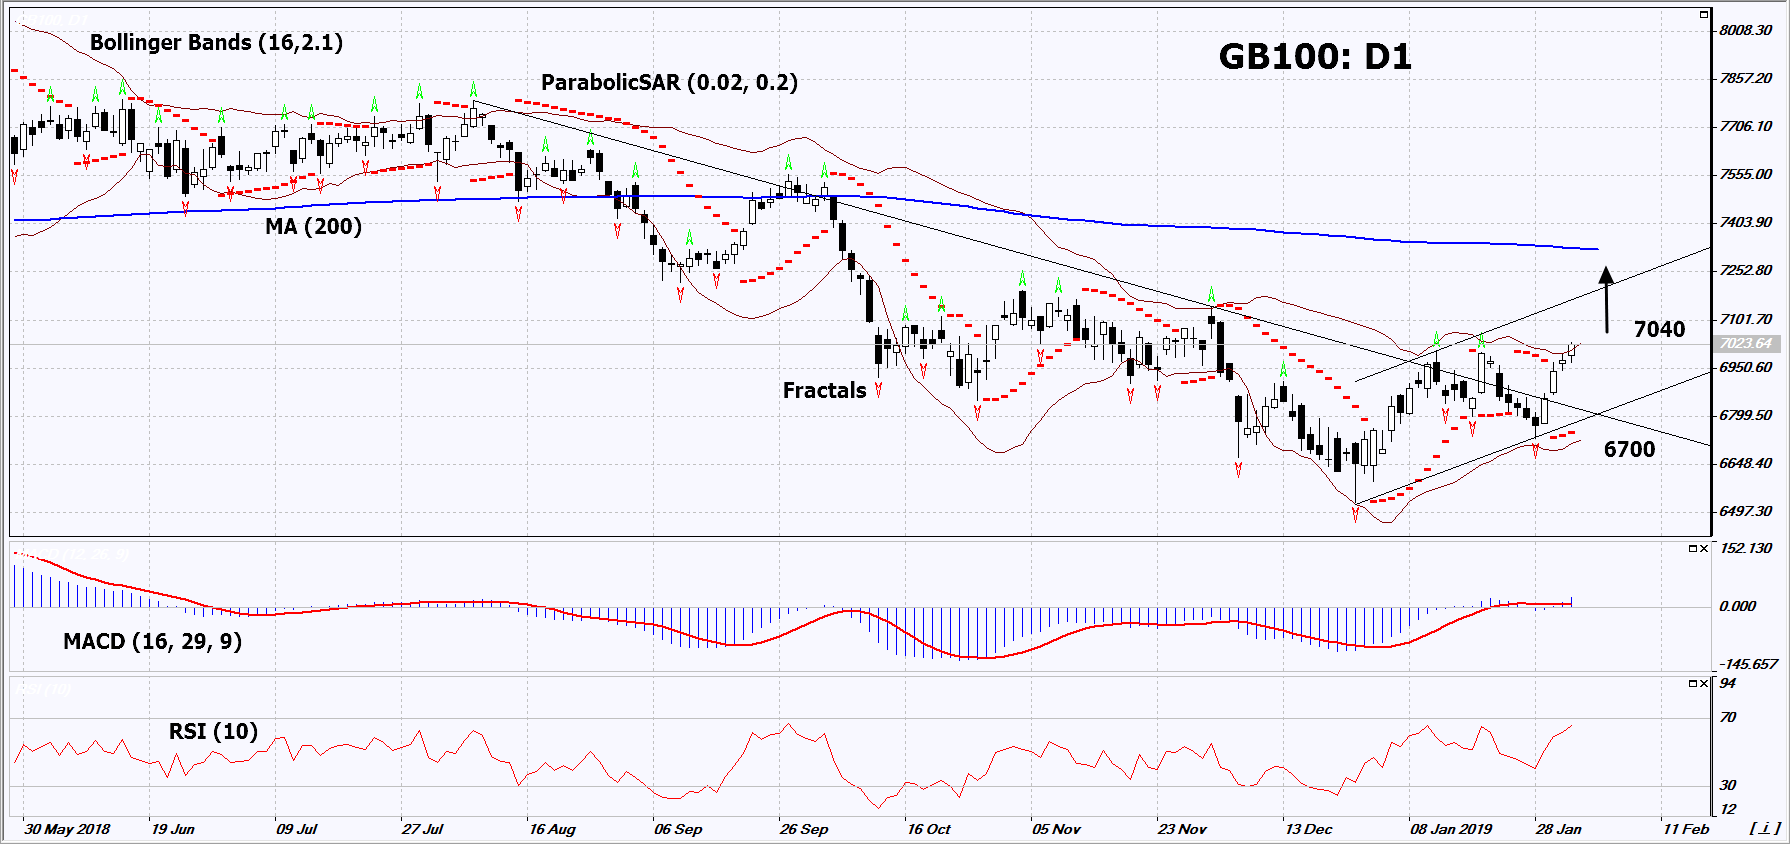
On the daily timeframe, GB100: D1 has moved from the downtrend to the uptrend. The further price increase is possible in case of the publication of positive quarterly earnings reports of UK companies and good political news.
- The Parabolic indicator gives a bullish signal.
- The Bollinger bands have narrowed, which indicates low volatility. Both Bollinger bands are titled upwards.
- The RSI indicator is above 50, but it has not reached the overbought area yet. No divergence.
- The MACD indicator gives a bullish signal.
The bullish momentum may develop in case GB100 exceeds the last high, the two fractal highs and the upper Bollinger band at 7040. This level may serve as an entry point. The initial stop loss may be placed below the last fractal low, the parabolic signal and the lower Bollinger band at 6700. After opening the pending order, we shall move the stop to the next fractal low following the Bollinger and Parabolic signals. Thus, we are changing the potential profit/loss to the breakeven point. More risk-averse traders may switch to the 4-hour chart after the trade and place there a stop loss moving it in the direction of the trade. If the price meets the stop level (6700) without reaching the order (7040), we recommend to close the position: the market sustains internal changes that were not taken into account.
Summary of technical analysis
| Position | Buy |
| Buy stop | Above 7040 |
| Stop loss | Below 6700 |
- Obtenir un certificat

NB:
Cet aperçu a un caractère instructif et didactique, publié gratuitement. Toutes les données, comprises dans l'aperçu, sont reçues de sources publiques, reconnues comme plus ou moins fiables. En outre, rien ne garantit que les informations indiquées sont complètes et précises. Les aperçus ne sont pas mis à jour. L'ensemble de l'information contenue dans chaque aperçu, y compris l'opinion, les indicateurs, les graphiques et tout le reste, est fourni uniquement à des fins de familiarisation et n'est pas un conseil financier ou une recommandation. Tout le texte entier et sa partie, ainsi que les graphiques ne peuvent pas être considérés comme une offre de faire une transaction sur chaque actif. IFC Markets et ses employés, dans n'importe quelle circonstance, ne sont pas responsables de toute action prise par quelqu'un d'autre pendant ou après la lecture de l’aperçu.
