- Analyses
- Analyse technique
GBP/USD Analyse technique - GBP/USD Trading: 2014-12-01
OPEC: dollar appreciation
The fallen oil futures prices after the OPEC meeting resulted in a significant depreciation of commodity currencies against the US dollar: it was in favour of USD and led to a significant strengthening of the dollar index. Today at 14:00 CET we expect the monthly release of ISM Manufacturing PMI in the United States. This diffusion index is based on a survey of 400 purchasing managers in the manufacturing industry, which evaluate employment, output volume, orders and stockpiles. It is the most important economic indicator as it permits obtaining preliminary information on manufacturing activity which affects the investor optimism. In our opinion, the greatest volatility is expected today from the US currency relative to other liquid instruments of the currency market.
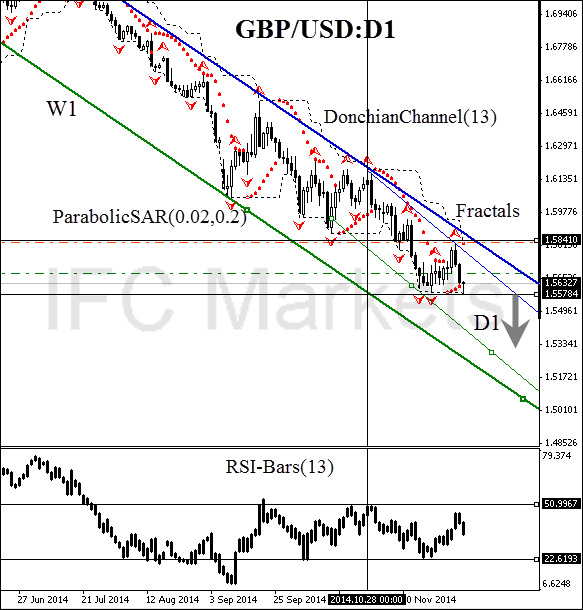
| Position | Sell |
| Sell stop | below 1.55784 |
| Stop loss | above 1.58410 |
Dear traders. For the detailed report of the strategy based on analytical issues of technical analysis click here.
- Obtenir un certificat

NB:
Cet aperçu a un caractère instructif et didactique, publié gratuitement. Toutes les données, comprises dans l'aperçu, sont reçues de sources publiques, reconnues comme plus ou moins fiables. En outre, rien ne garantit que les informations indiquées sont complètes et précises. Les aperçus ne sont pas mis à jour. L'ensemble de l'information contenue dans chaque aperçu, y compris l'opinion, les indicateurs, les graphiques et tout le reste, est fourni uniquement à des fins de familiarisation et n'est pas un conseil financier ou une recommandation. Tout le texte entier et sa partie, ainsi que les graphiques ne peuvent pas être considérés comme une offre de faire une transaction sur chaque actif. IFC Markets et ses employés, dans n'importe quelle circonstance, ne sont pas responsables de toute action prise par quelqu'un d'autre pendant ou après la lecture de l’aperçu.
