- Analyses
- Analyse technique
HSI Analyse technique - HSI Trading: 2018-11-27
Hong Kong’s index rises in anticipation of the meeting of leaders of the USA and China
Hong Kong’s Hang Seng Index increases on the eve of the G20 summit. Will the HK50 continue to rise?
The G20 summit will be held in Argentina from November 30 to December 1, 2018. It is expected that during the meeting, US President Donald Trump and China’s President Xi Jinping will talk about the mitigation of mutual foreign trade restrictions. This may have a positive impact on stock prices of Chinese companies. It can be noted that securities of the financial sector and real estate companies are in great demand in the Hang Seng Index. Hong Kong’s stock index is now trading with a P/E ratio (capitalization / total earnings per year) of 10.3 and a dividend yield of 3.6%. This is noticeably less than that of the American S&P 500 and is comparable with similar indicators of Germany’s DAX index.
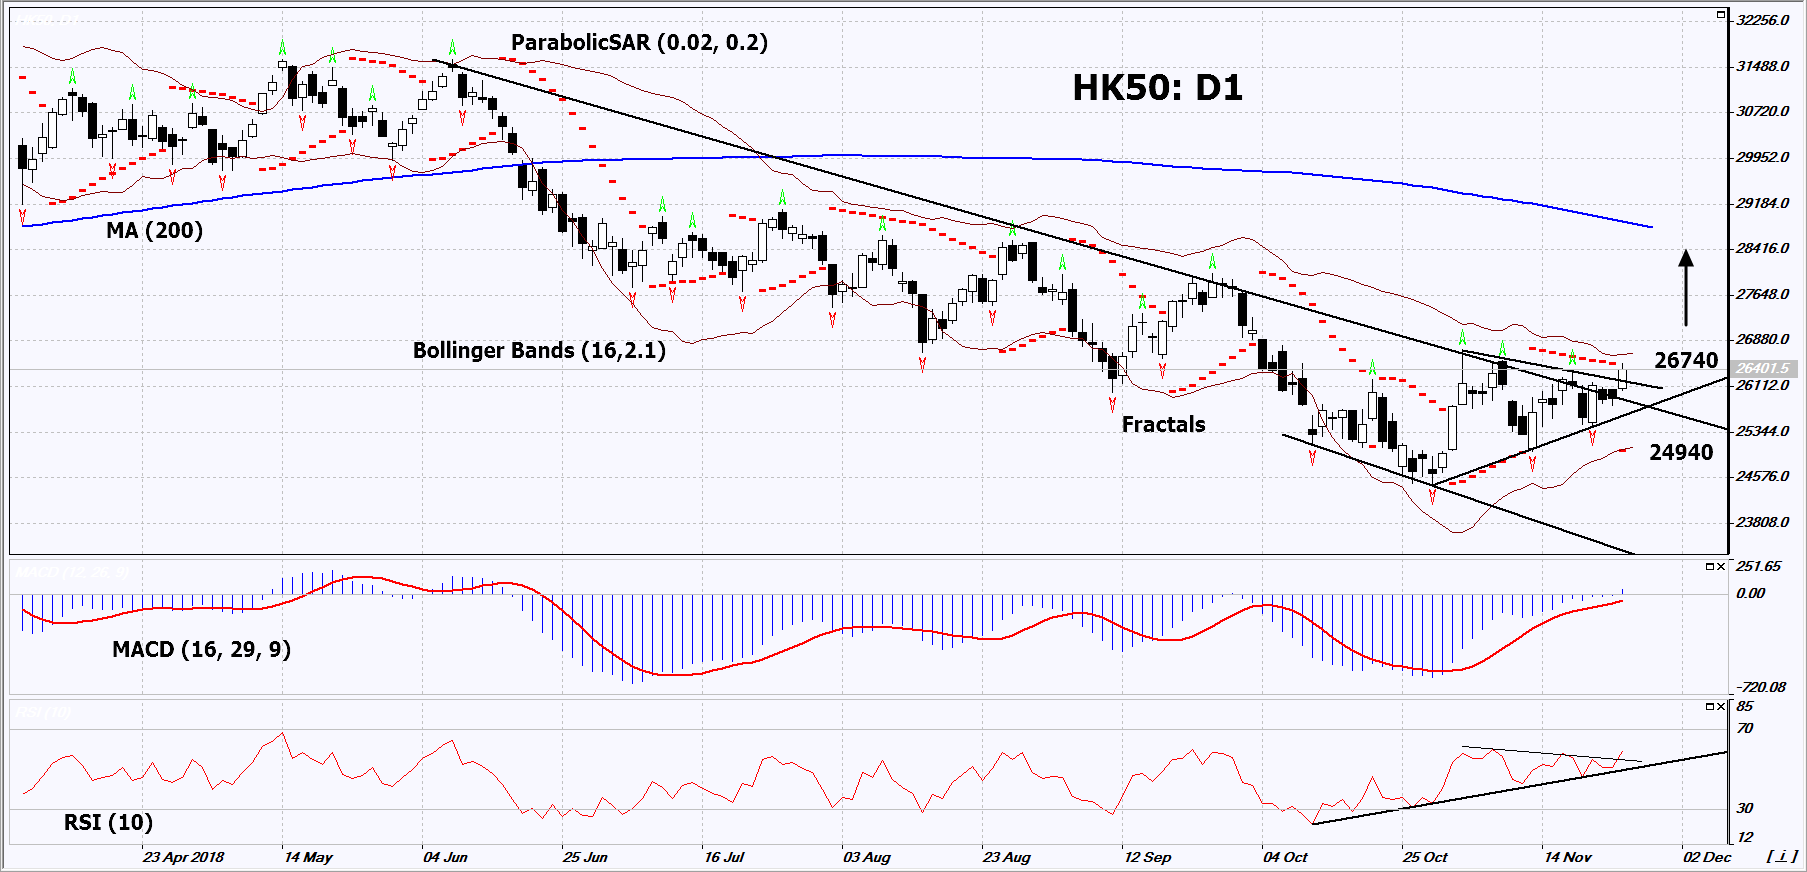
On the daily timeframe, HK50: D1 breached up the resistance line of the downtrend and is trying to correct up from the low since April 2017. The further price increase is possible in case of a positive outcome of the US-Chine talks and good corporate news.
- The Parabolic indicator gives a bullish signal․
- The Bollinger bands have narrowed, which indicates low volatility. Both bands are titled upwards.
- The RSI indicator is above 50, but it has not reached the overbought area yet. No new divergences.
- The MACD indicator gives a bullish signal.
The bullish momentum may develop in case HK50 exceeds three last fractal highs and the upper Bollinger band at 26740. This level may serve as an entry point. The initial stop loss may be placed below the two last fractal lows, the Parabolic signal and the lower Bollinger band at 24940. After opening the pending order, we shall move the stop to the next fractal low following the Bollinger and Parabolic signals. Thus, we are changing the potential profit/loss to the breakeven point. More risk-averse traders may switch to the 4-hour chart after the trade and place there a stop loss moving it in the direction of the trade. If the price meets the stop level (24940) without reaching the order (26740), we recommend to close the position: the market sustains internal changes that were not taken into account.
Summary of technical analysis
| Position | Buy |
| Buy stop | Above 26740 |
| Stop loss | Below 24940 |
- Obtenir un certificat

NB:
Cet aperçu a un caractère instructif et didactique, publié gratuitement. Toutes les données, comprises dans l'aperçu, sont reçues de sources publiques, reconnues comme plus ou moins fiables. En outre, rien ne garantit que les informations indiquées sont complètes et précises. Les aperçus ne sont pas mis à jour. L'ensemble de l'information contenue dans chaque aperçu, y compris l'opinion, les indicateurs, les graphiques et tout le reste, est fourni uniquement à des fins de familiarisation et n'est pas un conseil financier ou une recommandation. Tout le texte entier et sa partie, ainsi que les graphiques ne peuvent pas être considérés comme une offre de faire une transaction sur chaque actif. IFC Markets et ses employés, dans n'importe quelle circonstance, ne sont pas responsables de toute action prise par quelqu'un d'autre pendant ou après la lecture de l’aperçu.
