- Analyses
- Analyse technique
HSI Analyse technique - HSI Trading: 2019-01-03
Negative data bearish for HK50
Hong Kong’s trade deficit widened in November. Will the HK50 continue declining?
Recent Chinese economic data were negative: manufacturing slowed in China in December while trade deficit widened in Hong Kong in November. Markit reported that Caixin Manufacturing PMI declined more than expected in December, indicating contraction in China’s manufacturing sector. And Census and Statistics Department of Hong Kong data showed trade deficit widened to HKD 45.0 billion in November of 2018 from HKD 39.7 billion in the same month a year earlier. The slowing of activities in manufacturing sector is being attributed to deteriorated US-China trade relations, though President Trump tweeted over the weekend about “big progress” in a telephone discussion about trade with Chinese leader Xi Jinping. Weak economic data are bearish for HK50.
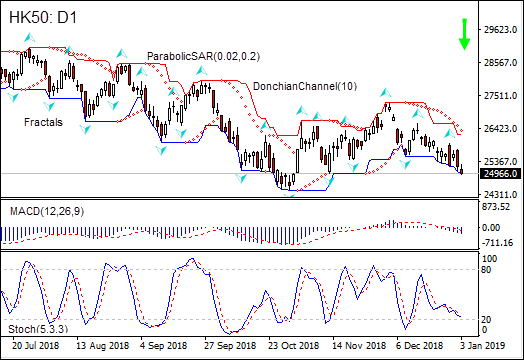
On the daily timeframe the HK50: D1 is falling after retracing to three-month high in the end of September.
- The Parabolic indicator gives a sell signal.
- The Donchian channel indicates downtrend: it is tilted lower.
- The MACD indicator gives a bearish signal: it is below the signal line and the gap is widening.
- The Stochastic oscillator is falling but has not breached into oversold zone yet.
We believe the bearish momentum will continue after the price breaches below lower boundary of Donchian channel at 24926.5. This level can be used as an entry point for placing a pending order to sell. The stop loss can be placed above the last fractal high at 25958.0. After placing the order, the stop loss is to be moved every day to the next fractal high, following Parabolic signals. Thus, we are changing the expected profit/loss ratio to the breakeven point. If the price meets the stop loss level (25958.0) without reaching the order (24926.5), we recommend cancelling the order: the market has undergone internal changes which were not taken into account.
Technical Analysis Summary
| Position | Sell |
| Sell stop | Below 24926.5 |
| Stop loss | Above 25958.0 |
- Obtenir un certificat

NB:
Cet aperçu a un caractère instructif et didactique, publié gratuitement. Toutes les données, comprises dans l'aperçu, sont reçues de sources publiques, reconnues comme plus ou moins fiables. En outre, rien ne garantit que les informations indiquées sont complètes et précises. Les aperçus ne sont pas mis à jour. L'ensemble de l'information contenue dans chaque aperçu, y compris l'opinion, les indicateurs, les graphiques et tout le reste, est fourni uniquement à des fins de familiarisation et n'est pas un conseil financier ou une recommandation. Tout le texte entier et sa partie, ainsi que les graphiques ne peuvent pas être considérés comme une offre de faire une transaction sur chaque actif. IFC Markets et ses employés, dans n'importe quelle circonstance, ne sont pas responsables de toute action prise par quelqu'un d'autre pendant ou après la lecture de l’aperçu.
