- Analyses
- Analyse technique
USD/JPY Analyse technique - USD/JPY Trading: 2016-12-27
Significant economic data will come out in Japan
On Tuesday early in the morning the inflation data and household spending for November will come out in Japan. We believe they may make yen a bit stronger. Will USDJPY chart fall?
Due to preliminary forecasts, household spending rose in Japan in November for the first time since this February. This may revive the economy. Moreover, despite the expected same pace of core deflation year over year, it may fall in November to -0.3% from -0.4% in October 2016. The Bank of Japan aims at fighting deflation and reaching 2% inflation. Weak consumer confidence for December is expected to come out in US on Tuesday which may support the yen rate against the US dollar. Manufacturing production for November will come out in Japan on Wednesday. According to forecasts, they may be positive for the yen. Next significant data will come only on January 4, 2017.
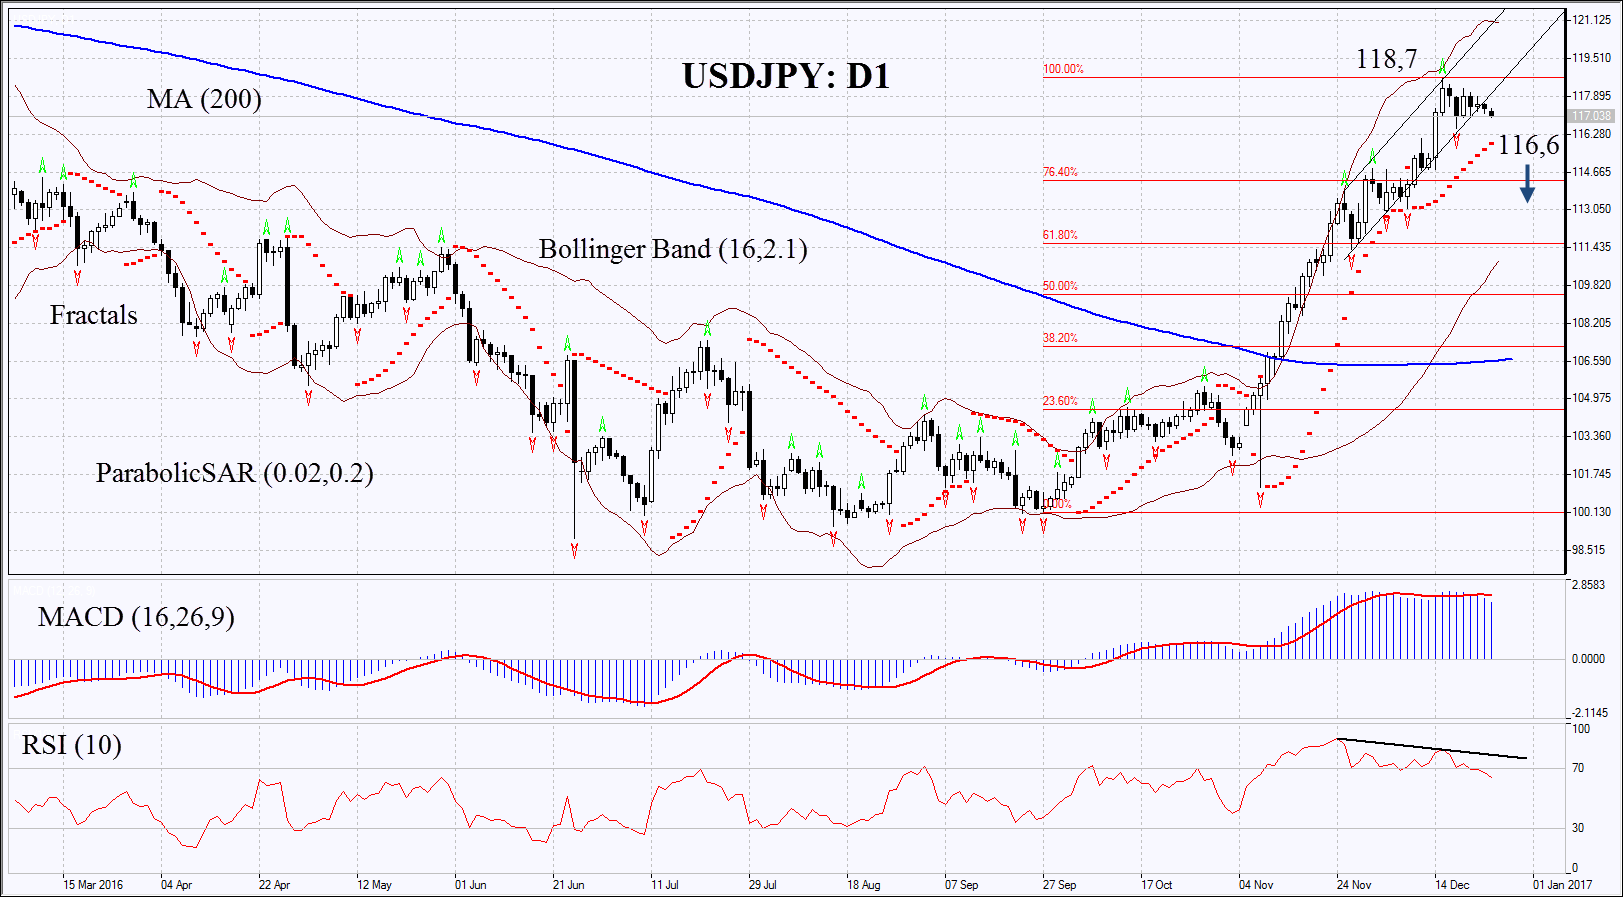
On the daily chart USDJPY: D1 is trending upwards. It hit a 11-month high two weeks ago. Now the pace of growth has slowed down and several technical indicators point at the chance of downward correction. Further strengthening of yen is possible in case of positive economic data in Japan and negative in US.
- Parabolic gives bullish signals which may serve an additional level of support. In such a case the price shall fall below the support to open a position.
- Bollinger bands have widened which means higher volatility.
- RSI has left the overbought zone having formed negative divergence.
- MACD gives bearish signals.
The bearish momentum may develop in case USDJPY falls below the last fractal low at 116.6. This level may serve the point of entry. The initial stop-loss may be placed above the 11-month high at 118.7. Having opened the pending order we shall move the stop to the next fractal high following the Parabolic and Bollinger signals. Thus, we are changing the probable profit/loss ratio to the breakeven point. The most risk-averse traders may switch to the 4-hour chart after the trade and place there a stop-loss moving it in the direction of the trade. If the price meets the stop-loss level at 118.7 without reaching the order at 116.6, we recommend cancelling the position: the market sustains internal changes which were not taken into account.
Summary of technical analysis
| Position | Sell |
| Sell stop | below 116.6 |
| Stop loss | above 118.7 |
- Obtenir un certificat

NB:
Cet aperçu a un caractère instructif et didactique, publié gratuitement. Toutes les données, comprises dans l'aperçu, sont reçues de sources publiques, reconnues comme plus ou moins fiables. En outre, rien ne garantit que les informations indiquées sont complètes et précises. Les aperçus ne sont pas mis à jour. L'ensemble de l'information contenue dans chaque aperçu, y compris l'opinion, les indicateurs, les graphiques et tout le reste, est fourni uniquement à des fins de familiarisation et n'est pas un conseil financier ou une recommandation. Tout le texte entier et sa partie, ainsi que les graphiques ne peuvent pas être considérés comme une offre de faire une transaction sur chaque actif. IFC Markets et ses employés, dans n'importe quelle circonstance, ne sont pas responsables de toute action prise par quelqu'un d'autre pendant ou après la lecture de l’aperçu.
