- Analyses
- Analyse technique
l'Or Analyse technique - l'Or Trading: 2017-05-11
Fed policy tightening weighs on gold prices
Inflation near Fed’s target threshold 2% and strong labor market support Fed policy tightening. This will strengthen the US dollar and pressure gold. Will gold continue falling?
The win by centrist Emmanuel Macron in French presidential election runoff on May 7 removed the major political uncertainty supporting gold prices recently. The defeat of National Front leader Marine Le Pen eliminated the danger to European Union integrity: Marine Le Pen had vowed to hold a referendum on European Union membership in six months time if she won. She also supported abandoning euro. With a major bullish factor removed, gold prices remain subject to the same bearish factor – tightening of Fed monetary policy. On Tuesday Kansas City Fed President Esther George said the central bank should still stick to gradually raising rates despite some recent soft data such as low first quarter GDP at 0.7% annual rate and lower auto sales. George supported also shrinking Fed’s balance sheet later this year by reducing reinvestments in maturing mortgage-backed securities and long-term Treasury securities. In last week’s FOMC statement central bank policy makers deemed first quarter GDP as ‘transitory’, noting that consumer spending continued to be solid, business investment had firmed and inflation has been "running close" to the Fed's target. According to the CME’s FedWatch tool, fed fund futures traders are pricing in an 88% chance of a rate increase at the US central bank’s June 14 meeting.
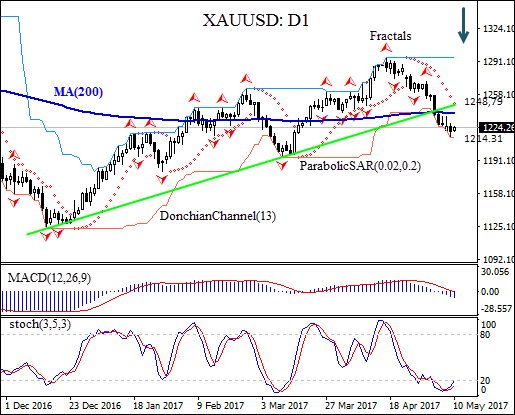
The XAUUSD: D1 has fallen below the 200-day moving average MA(200) on the daily chart, and the support line of the uptrend.
- Parabolic indicator gives a sell signal.
- The Donchian channel indicates no trend yet: it is flat.
- The MACD indicator is bearish.
- The stochastic oscillator is rising from the oversold zone.
We believe the bearish momentum will continue after the price closes below the lower Donchian boundary at $1214.31. A pending order to sell can be placed below that level. The stop loss can be placed above the Parabolic signal at $1248.79. After placing the order, the stop loss is to be moved every day to the next fractal high, following Parabolic signals. Thus, we are changing the probable profit/loss ratio to the breakeven point. The most risk-averse traders may switch to the 4-hour chart after the trade and place there a stop-loss moving it in the direction of the trade. If the price meets the stop loss level ($1248.79) without reaching the order ($1214.31), we recommend canceling the position: the market sustains internal changes which were not taken into account.
Technical Analysis Summary
| Position | Sell |
| Sell stop | Below 1214.31 |
| Stop loss | Above 1248.79 |
- Obtenir un certificat

NB:
Cet aperçu a un caractère instructif et didactique, publié gratuitement. Toutes les données, comprises dans l'aperçu, sont reçues de sources publiques, reconnues comme plus ou moins fiables. En outre, rien ne garantit que les informations indiquées sont complètes et précises. Les aperçus ne sont pas mis à jour. L'ensemble de l'information contenue dans chaque aperçu, y compris l'opinion, les indicateurs, les graphiques et tout le reste, est fourni uniquement à des fins de familiarisation et n'est pas un conseil financier ou une recommandation. Tout le texte entier et sa partie, ainsi que les graphiques ne peuvent pas être considérés comme une offre de faire une transaction sur chaque actif. IFC Markets et ses employés, dans n'importe quelle circonstance, ne sont pas responsables de toute action prise par quelqu'un d'autre pendant ou après la lecture de l’aperçu.
